Classes | |
| struct | Histogram1D |
Functions | |
| Histogram1D | makeHistogram (const std::vector< double > &samples, double low, double high, std::size_t nBins) |
| double | l1Distance (const Histogram1D &sampled, const std::vector< double > &analyticPdf) |
| double | histogramArea (const Histogram1D &h) |
| Riemann sum of the histogram density (should be ~1 if all samples were in range). | |
| double | sampleMean (const std::vector< double > &samples) |
| void | writeSpectrumCsv (const std::string &path, const Histogram1D &h, const std::vector< double > &analyticPdf, const std::string &xLabel) |
Function Documentation
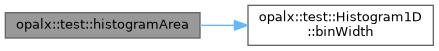
◆ histogramArea()
|
inline |
Riemann sum of the histogram density (should be ~1 if all samples were in range).
Definition at line 85 of file SpectrumTestSupport.h.
References opalx::test::Histogram1D::binWidth(), and opalx::test::Histogram1D::density.
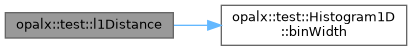
◆ l1Distance()
|
inline |
L1 distance between sampled density and an analytic PDF on the same binning. Both inputs are interpreted as densities; the integrand is |a - b| * binWidth.
Definition at line 72 of file SpectrumTestSupport.h.
References opalx::test::Histogram1D::binWidth(), and opalx::test::Histogram1D::density.
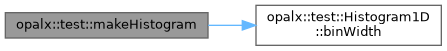
◆ makeHistogram()
|
inline |
Definition at line 38 of file SpectrumTestSupport.h.
References opalx::test::Histogram1D::binWidth(), opalx::test::Histogram1D::counts, opalx::test::Histogram1D::density, opalx::test::Histogram1D::high, opalx::test::Histogram1D::low, and opalx::test::Histogram1D::nBins.
◆ sampleMean()
|
inline |
Definition at line 94 of file SpectrumTestSupport.h.
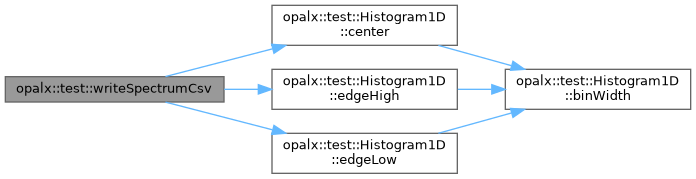
◆ writeSpectrumCsv()
|
inline |
Write a CSV consumable by tools/spectrum_plots/plot_spectrum.py. Header: "# x_label: <xLabel>\n# columns: bin_low,bin_high,bin_center,density,count,analytic_pdf\n"
Definition at line 108 of file SpectrumTestSupport.h.
References opalx::test::Histogram1D::center(), opalx::test::Histogram1D::counts, opalx::test::Histogram1D::density, opalx::test::Histogram1D::edgeHigh(), opalx::test::Histogram1D::edgeLow(), and opalx::test::Histogram1D::nBins.